
Research Article 
 Creative Commons, CC-BY
Assessment of the Indoor Air Quality (IAQ) in Lead City University Classrooms and Offices
*Corresponding author:Olanrewaju John Adedayo, Department of Environmental Health Sciences, Faculty of Basic Medical and Health Science, Lead City University, Ibadan. Nigeria..
Received:August 12, 2025;; Published:August 25, 2025
DOI: 10.34297/AJBSR.2025.28.003663
Abstract
Indoor Air Quality (IAQ), particularly in educational facilities, is gaining considerable interest and is a synonymous indicator towards evaluating
human comfort. Factors such as CO2 concentration, temperature, and humidity play crucial parts in determining an acceptable level of IAQ. Many
studies have also demonstrated that the indoor air quality of classrooms affects students’ concentration and performance.
The research utilized both objective measurements and subjective surveys. Air temperature, CO2 levels and humidity were measured by hand-handling
Bosean Air Quality detector in Lead City University, Ibadan. Temperature, Carbon dioxide, carbon monoxide, humidity and particulate matter
(PM2.5), air quality index (AQI), TVCO and HCHO measurements were conducted over two weeks’ period and the minimum and maximum temperature
over 10 continuous days for each learning environment were recorded. Temperature and RH levels generally fall within the permissible levels
recommended by the WHO which contributed to the conducive living environment. Carbon dioxide and Carbon monoxide levels in most locations
are also within the permissible levels with little location that deviated and need monitoring. Therefore, through investigation is needed is needed in
all the locations that are higher than the WHO recommended values.
Keywords:Indoor Air Quality (IAQ), Temperature, Carbon dioxide, Carbon monoxide, Particulate Matter, Relative Humidity, TVO, HCHO and Lead City University (LCU)
Introduction
Air pollution is now a serious worldwide public health problem. Developmental activities like industrial expansion, mining exploration, transportation and constructional works etc. cause degradation and drastic changes in every component of environment. Air pollution has emerged in the past few decades as the most crucial problem to mankind and many studies in this regard have been undertaken in all over the World [1]. Indoor workspaces refer to areas within a building where people carry out work-related activities. These spaces may include offices, meeting rooms, laboratories, manufacturing facilities, and other work environments that are enclosed and not exposed to the outdoor environment. The quality of indoor air in these workspaces can have a significant impact on the health, comfort, and productivity of the occupants. [2]. Air pollution and its detrimental health impacts have become a major global environmental and health concern, and the mitigation of air pollution is a primary focus of policymakers. Many air pollutants are extremely detrimental to health. Rapid population growth, increase in vehicular traffic, urban expansion and the burning of solid biomass fuel are considered some of the main factors contributing to poor air quality in Africa [3,4].
Insufficient quality of the indoor environment for the learning purpose can prevent students and teachers from progressing in their learning process. Students’ attention may stray away from learning goals due to the influence of the internal environment and its determining parameters. The indoor environment is defined by several partial elements – thermal and humidity parameters, ventilation, lighting, acoustics, odours, and microbial, aerosol and ionization factor [5]. The parameters of Indoor Air Quality (IAQ) influence not only health but also the ability to learn and work. The results of the studies show that in the case of full occupancy of the classrooms, the indoor air quality deteriorates rapidly. The concentration of Carbon dioxide (CO2) in the classrooms is rapidly rising [6]. Other independent studies demonstrate the effect of internal quality on performance and productivity [7-9]. The quality of the internal environment in schools also influences the student-perceived social climate [10].
The importance of indoor air quality has become increasingly recognized in recent years, with numerous studies highlighting its impact on health and productivity. For example, a study by 5 found that improved indoor air quality was associated with significant improvements in cognitive function, including decision-making and problem-solving skills [11]
In addition to its impact on human health and productivity, indoor air quality is also a significant concern from an environmental perspective. The use of energy-intensive Heating, Ventilation, And Air Conditioning (HVAC) systems to regulate indoor air temperature and quality can contribute to greenhouse gas emissions and climate change [12]. The quality of the internal environment in schools also influences the student-perceived social climate [13,14].
The scope of study is to assess the Indoor Air Quality of classrooms in Lead City University by monitoring indoor air parameters (temperature, relative humidity, carbon monoxide, carbon dioxide, ozone, total volatile organic compounds in different classrooms.
This study when completed will benefit
1. Occupants of indoor workspaces: The study can benefit the
occupants of indoor workspaces by providing a healthier and
more comfortable environment, which can lead to improved
well-being, reduced sick leave, and increased job satisfaction.
2. Future researcher: This research work will provide literature
for references for future researches.
Aim and Objectives of the Study
The general objective of the study is to examine the indoor air
quality in Lead City University Classrooms and Offices. While the
specific objectives of the study are:
1. To measure Indoor Air Quality (IAQ) in Lead City University
classrooms
2. To compare the level of measured indoor air quality of Lead
City University classrooms with World Health Organization
(WHO) permissible levels of indoor air quality.
3. To proffer solution to the problem of indoor air quality pollution
in Lead City University, Ibadan
Research Question
1. What are the different levels of Indoor Air Quality (IAQ) in
Lead City University, Ibadan classrooms?
2. Is the measured Indoor Air Quality (IAQ) in Lead City University
classrooms below or above the World Health Organization
(WHO) permissible levels indoor air quality?
3. What are the solutions to the problem of indoor air quality pollution
in Lead City University, Ibadan?
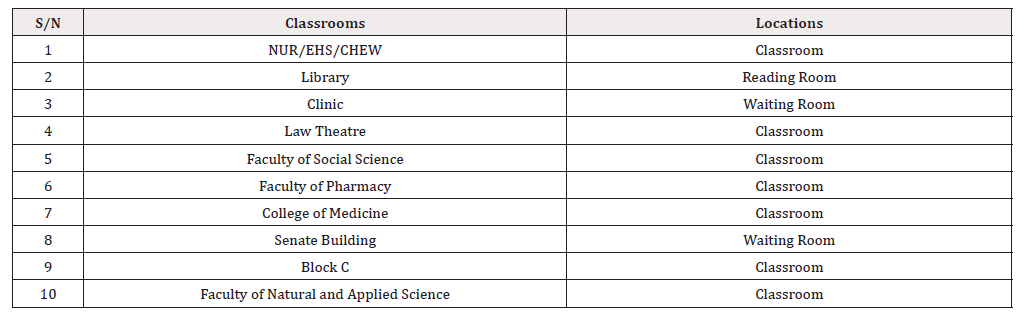
Table 1:Classroom locations selected in Lead City University, Ibadan.
Materials and Methods
Ten (10) classrooms (1-10) are selected in Lead City University, Ibadan to investigate the university’s indoor environment. One of the tested university classes is block C (9). The walls and ceilings are fitted with a classic internal plaster with white paint. Flooring is PVC linoleum. The windows are new, plastic with a shading system of internal blinds. The classroom equipment is classical and includes tables, chairs and whiteboard. The survey was conducted during July 2023. The climate in Lead City University during July is cool and reasonably dry. Daytime maximum temperatures average around a cool 23, while at night 13°C is normal. Below is the classroom’s location used in the research work (Table 1).
This research would utilize both objective measurements and subjective surveys. Air temperature, CO2 levels and humidity would be measured and analyzed as an indicator for IAQ. The objectives datasets were collected using three different types of data loggers, namely: an internal Tinytag temperature and humidity data logger, an internal Tinytag CO2 data logger, and an external temperature and humidity data logger. In order to capture and distinguish changes of indoor environment, the data collection of this study was carried out before, during and after students’ classes over twoweek period. The data loggers were connected to power outlets and placed at 1.2m above the floor (average human sitting height) and would be in operation for the entire one-week duration. Other possible impact factors, such as the area of the monitored learning environment, the number of occupants, and the facilities within the rooms (such as computers) were also be recorded (the room volume and the activities being carried out can also affect the levels of CO2 and humidity, which may ultimately affect human comfort.
The university building investigated for this study is Lead City University, Ibadan, Oyo state; and represents a typical Higher Educational building across the country, Nigeria. Different types of learning spaces were selected within the University building, 10 in total as indicated in (Table 1) above. This also helped diversify the data, identify level of comfort in various rooms and also provided an opportunity to identify the effect of equipment in a room on user comfort. The level of installed ventilation (mechanical or natural) in support of health and safety guidelines were also be put into consideration. The objective measurements were compared to a permissible levels stipulated by World Health Organization (WHO) The survey were conducted the same time as the experimental measurements so as to analyze changes in IAQ perception over the duration of the classes.
Data Instruments and Collection
The indoor air temperature, relative humidity and carbon dioxide (CO2) concentration in the 10 selected learning spaces were measured by using HOBO U12-012 data loggers (temperature range-20; relative humidity ranges 5% - 95% ± 2.5%) and CARBOCAP CO2 monitors (measuring range 0-5000 ppm; accuracy±2% of range ± 2% of reading). The CO2 monitor was connected to a HOBO data logger via an external cable. All the devices were calibrated prior to the readings and the data would be recorded in 5minutes intervals.
Temperature Measurement: Temperature measurements were conducted over two weeks’ period and the minimum and maximum temperature over 10 continuous days for each learning environment were recorded.
Carbon Dioxide Measurement: The minimum and maximum CO2 levels across the 10 rooms over 10 continuous days were recorded.
Humidity Measurement: The relative humidity percentages were recorded within the 10 surveyed rooms over 10 days.
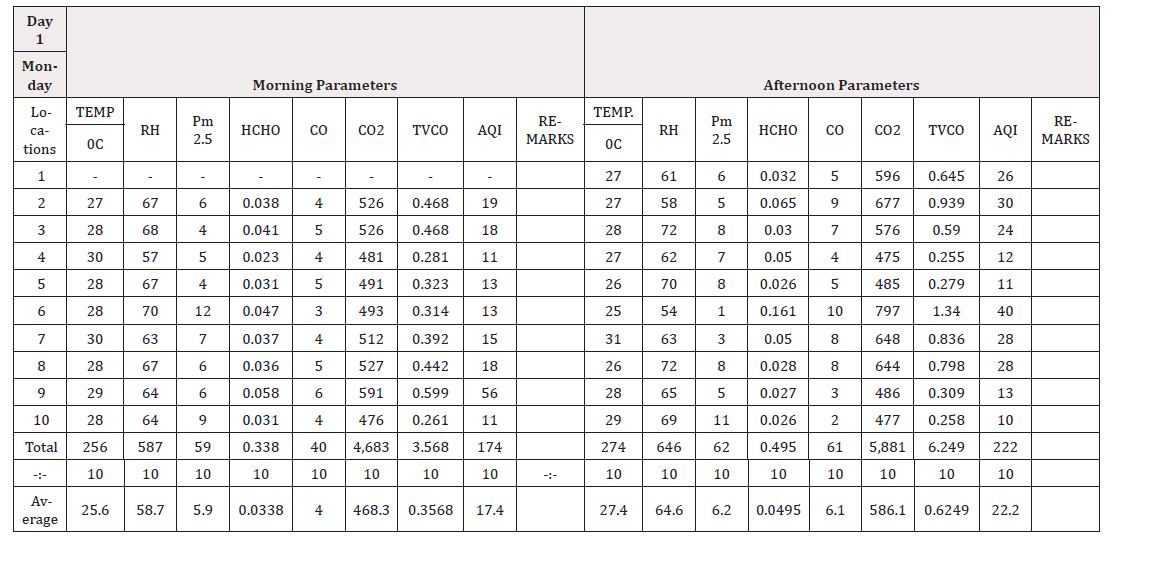
Table 2:Air Quality Measurements at NUR/EHS/CHEW.
Inclusion Criteria
Eligible locations were classrooms selected in Lead City University, Ibadan.
Exclusion Criteria
Outdoor spaces were excluded from this study.
Data Entry and Analysis
Data collected were analyzed with the aid of the computer software: Statistical Package for Social Sciences (SPSS) Version 20. Relevant means were calculated.
Results and Discussion of Findings
This chapter presents air quality measured at different locations in the university in order to assess the Indoor Air Quality (IAQ) in Lead City University Classrooms and Office.
Discussion of Findings
Air pollution is a significant environmental concern, with adverse effects on human health and the environment. The study aimed to assess the ambient air quality levels at different classroom within Lead City University, Ibadan. Temperature is a fundamental climatic factor that greatly influences our daily lives. From (Table 2), morning temperatures in the dataset range from a relatively mild 27°C to a warmer 28°C. These values reflect the diversity of climates or geographical locations represented in the data. In the afternoon, the temperature fluctuates more significantly, with the lowest recorded at 27°C and the highest at a notably warmer 29°C. Such fluctuations may be indicative of diurnal temperature variations or seasonal changes in different regions. The average morning temperatures range from 24.2°C to 25.6°C, with Location 4 having the highest average (26°C). This finding supported with the study that the high temperature can influence comfort levels and energy requirements in indoor and outdoor spaces1,4. Afternoon temperatures vary between 27.4°C and 27.7°C, with Location 2 and 9 (30.2°C) experiencing the highest average. The average morning temperatures mostly fall within a comfortable range. Afternoon temperatures also seem reasonable.
Consequently, relative humidity, another pivotal meteorological parameter, offers insights into the moisture content of the air. The morning RH levels in the result exhibit a range from 58.7% to 64.4%. This variance highlights disparities in atmospheric moisture content, possibly attributed to geographical and seasonal distinctions. Afternoon RH values, ranging from 41% to 64.6%, are slightly lower, suggesting a reduction in humidity as the day progresses. Morning RH values range from 58.7% to 64.4%, with Location 9 having the highest average (64.4%). Afternoon RH values are between 41% and 64.6%, with Location 4 having the highest average (82.9%). The relatively narrow variance in RH indicates that the dataset predominantly represents conditions with moderate humidity levels. Morning and afternoon relative humidity levels are generally within the comfortable range of 30% to 60% recommended by WHO [15].
Carbon dioxide (CO2) levels can serve as indicators of indoor air quality or the influence of anthropogenic activities. The result displays morning CO2 levels ranging from 468.3ppm to 565.5ppm, showcasing potential disparities in outdoor air quality or localized pollution sources. In the afternoon, CO2 levels vary more significantly, with the lowest value at 586.1ppm and an astonishingly high measurement of 542ppm in Location 3 (621.6ppm). Carbon monoxide (CO) concentrations, which can be derived from combustion processes, are another important environmental consideration. Morning CO levels are generally low, spanning from 4ppm to 6.4 ppm. The low variances indicate that CO levels remain relatively stable during the recorded periods. Carbon Monoxide (CO) levels are within acceptable limits according to WHO guidelines.
Particulate Matter (PM) concentrations, often associated with air quality and health concerns, are represented in the dataset. Morning PM levels vary from 5.7 to 7μg/m³, suggesting diverse air quality conditions across the samples. In the afternoon, PM concentrations display a broader range, from 6.2 to 12.8μg/m³. The high PM levels in Location 6 (12.8μg/m³,) could be due to industrial activity or pollution sources, posing health risks especially respiratory and cardiovascular health risks. Particulate Matter (PM) levels show variability, and some readings are higher than WHO guidelines, which can be a concern for air quality. The finding provides valuable information about environmental conditions, offering a glimpse into the variability and nuances of the recorded parameters. Hence, understanding these findings can contribute to informed decision-making in areas ranging from climate monitoring to public health and safety (Tables 3-12, Figures 1-22).
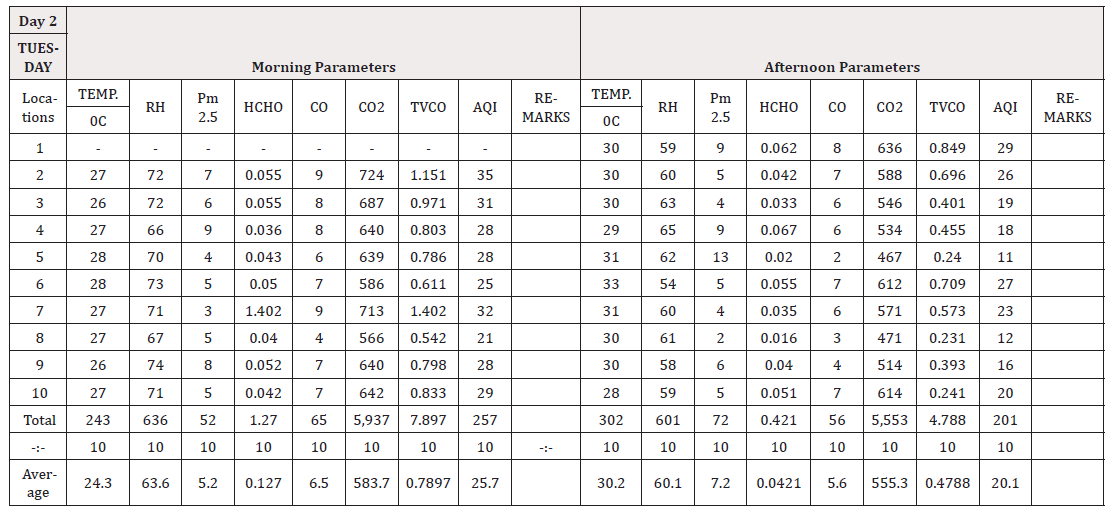
Table 3:Air Quality Measurements at University Library.
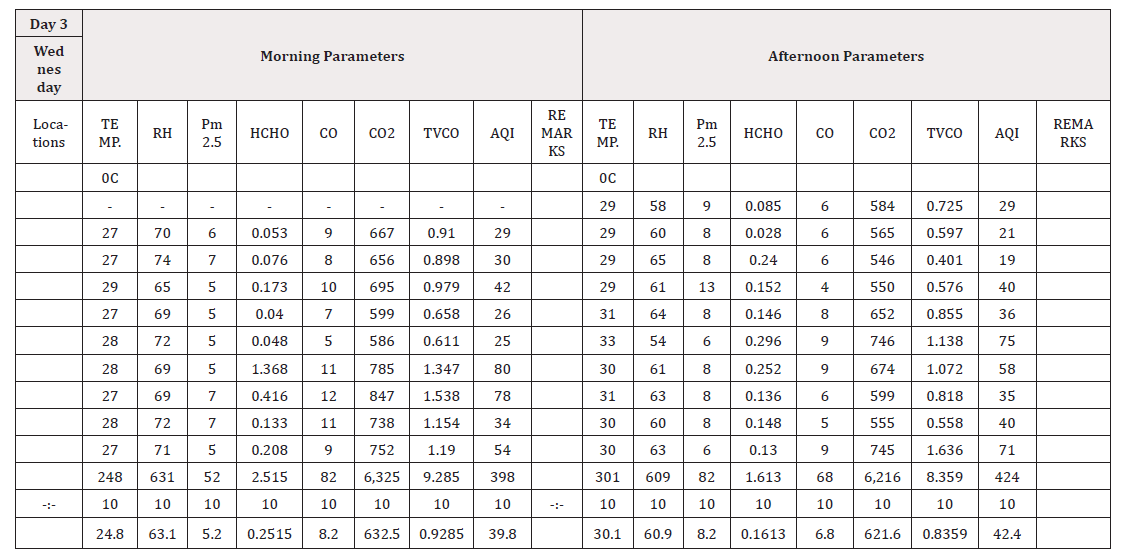
Table 4:Air Quality Measurements at University Clinic.
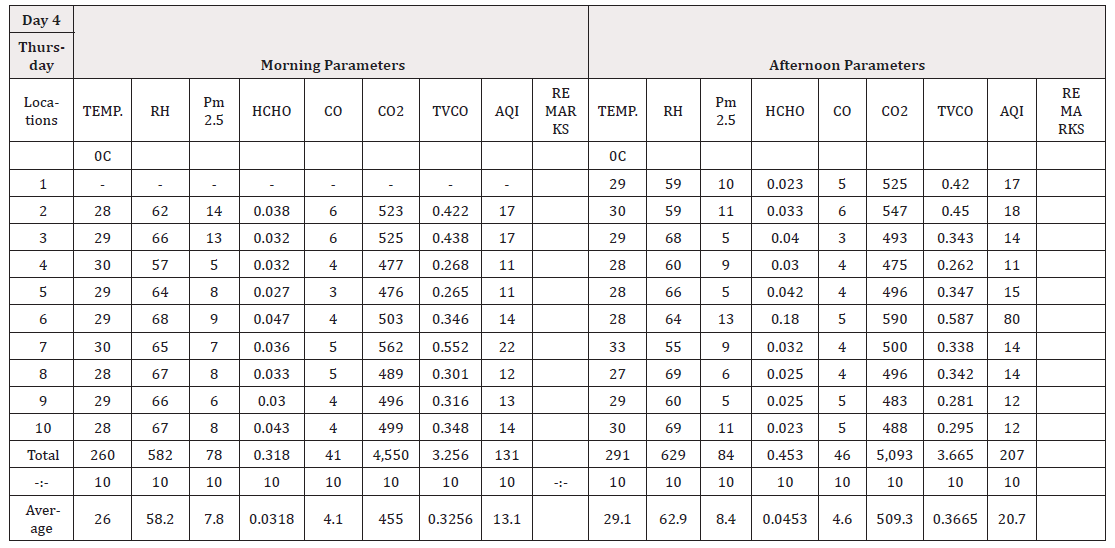
Table 5:Air Quality Measurements at Law Theatre.
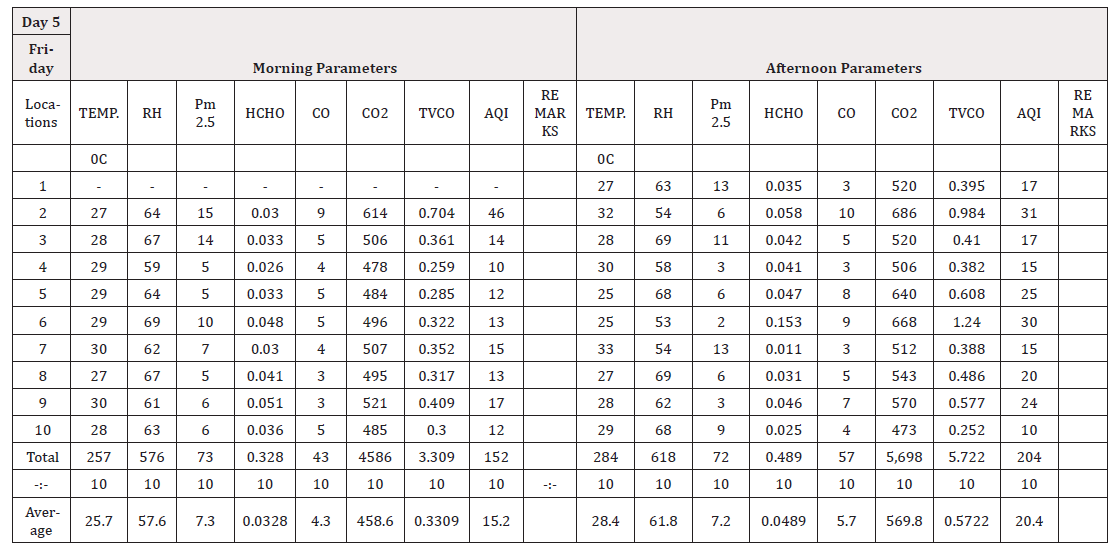
Table 6:Air Quality Measurements at Faculty of Pharmacy.
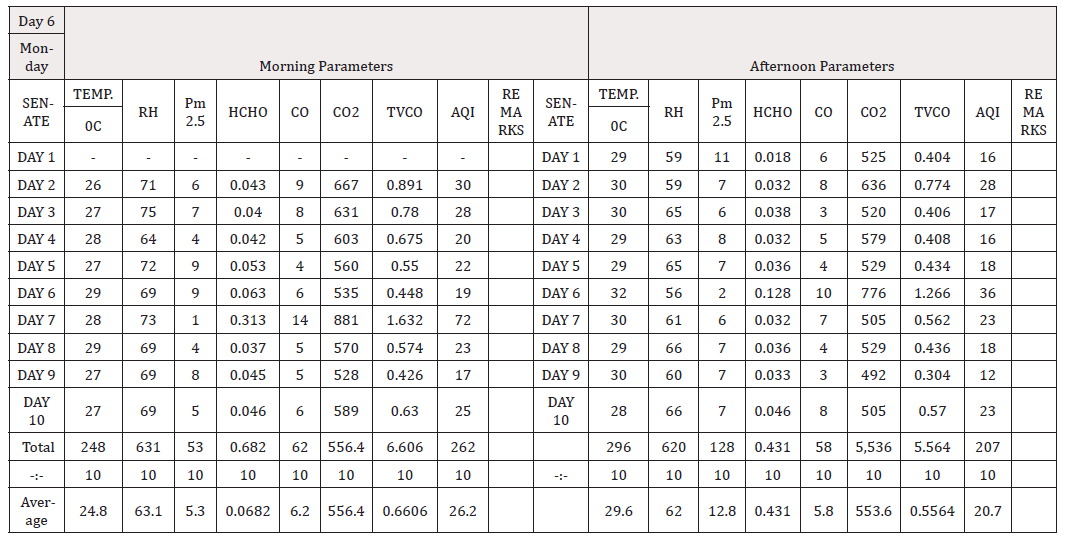
Table 7:Air Quality Measurements at Faculty of Social Science.
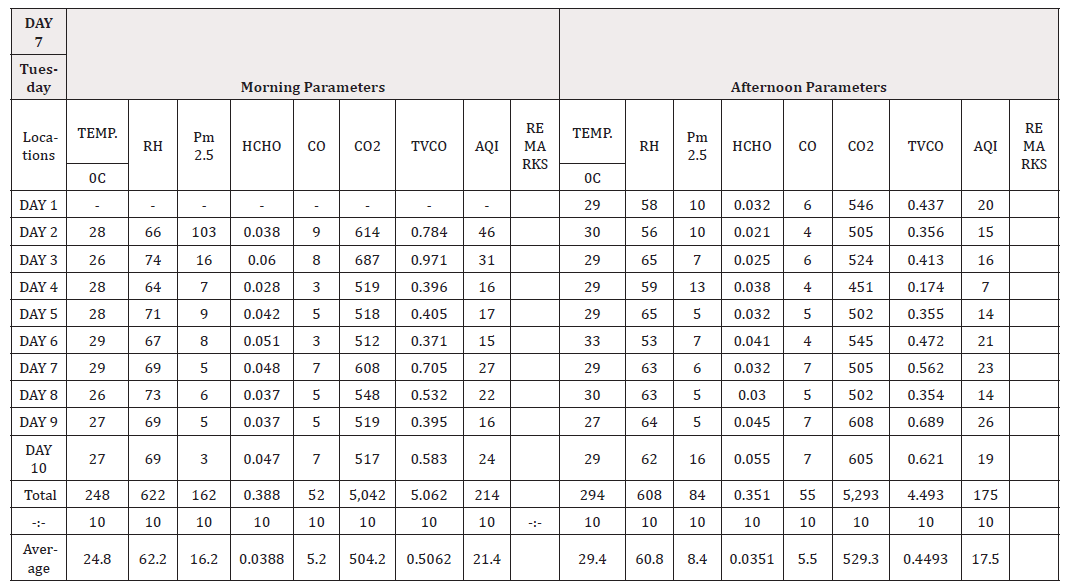
Table 8:Air Quality Measurements at College of Medicine.
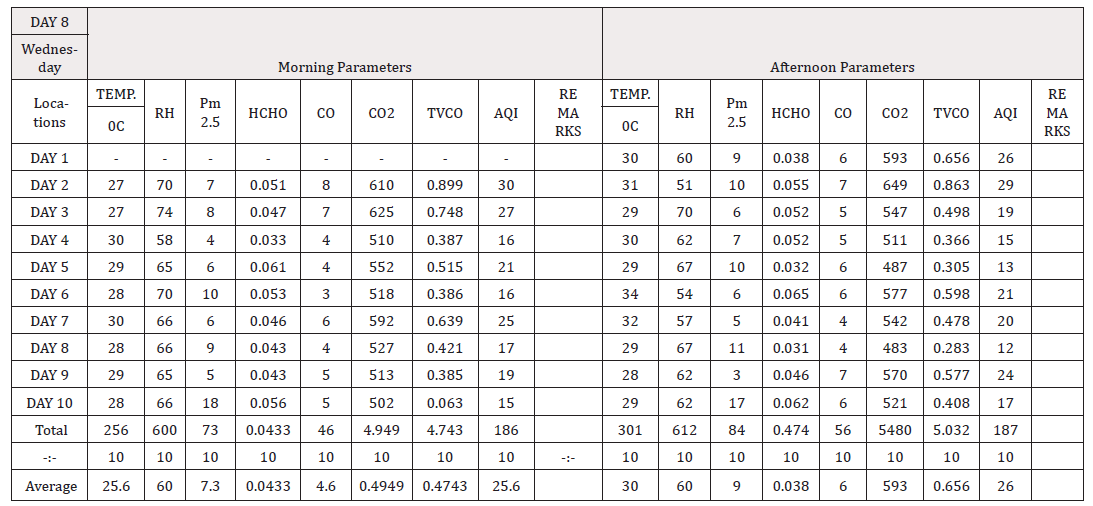
Table 9:Air Quality Measurements at Senate Building.
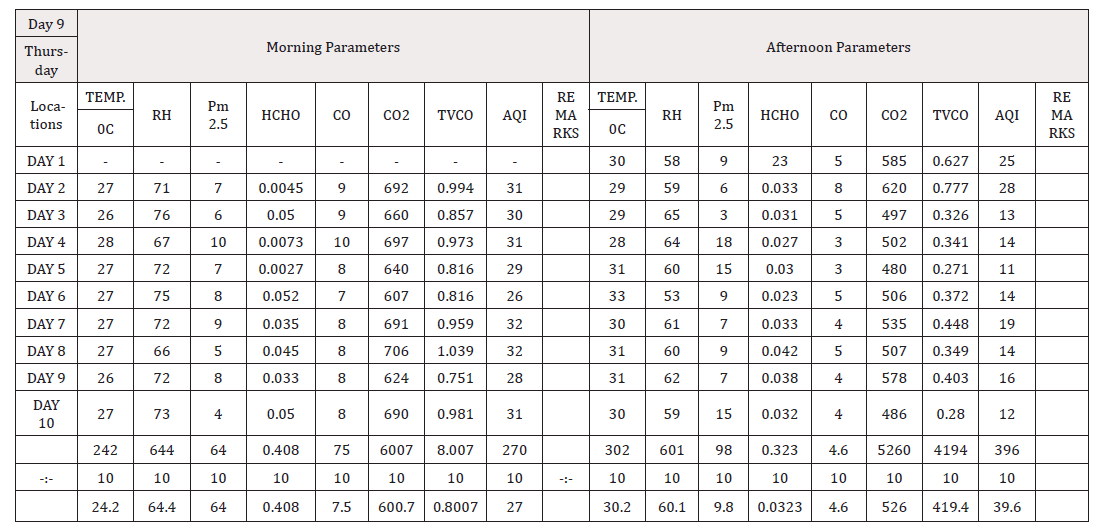
Table 10:Air Quality Measurements at Block C.
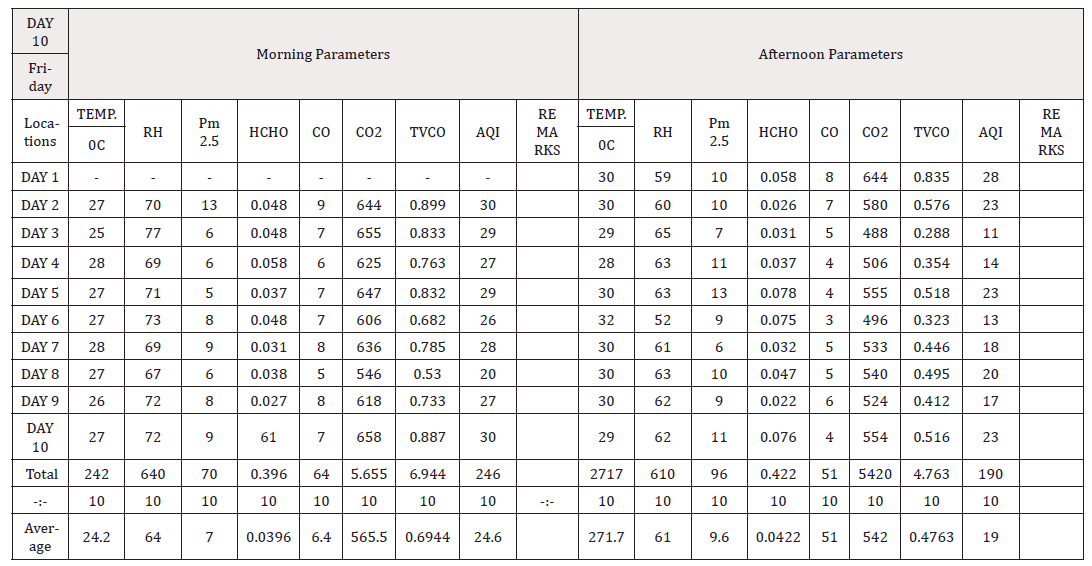
Table 11:Air Quality Measurements at Faculty of Natural and Applied Science.
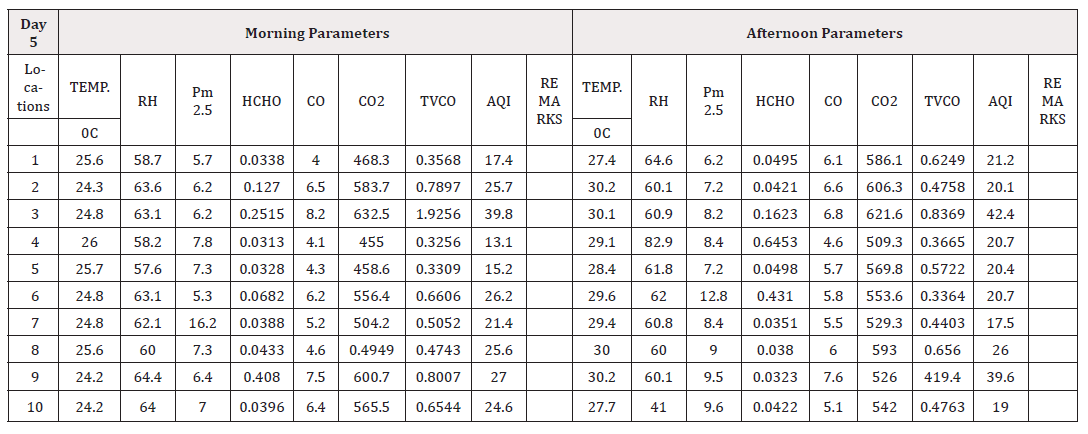
Table 12:Average Values of Air Quality Measurements.

Figure 1:DAY 1- NUR/EHS/CHEW-MORNING.

Figure 2:DAY 1- NUR/EHS/CHEW-AFTERNOON.

Figure 3:DAY 2- LIBRARY-MORNING.

Figure 4:DAY 2- LIBRARY-AFTERNOON.

Figure 5:DAY 3- CLINIC-MORNING.

Figure 6:DAY 3- CLINIC-AFTERNOON.’

Figure 7:DAY 4- LAW THEATRE- MORNING.

Figure 8:DAY 4- LAW THEATRE- AFTERNOON.

Figure 9:DAY 5- FACULTY OF PHARMACY.

Figure 10:DAY 5- FACULTY OF PHARMACY-AFTERNOON.

Figure 11:DAY 6-SENATE-MORNING.

Figure 12:DAY 6-SENATE-AFTERNOON.

Figure 13:DAY 7-COLLEGE OF MEDICINE-MORNING.

Figure 14:DAY 7-COLLEGE OF MEDICINE-AFTERNOON.

Figure 15:DAY 8-SENATE-MORNING.

Figure 16:DAY 8-SENATE-AFTERNOON.

Figure 17:DAY 9-BLOCK C-MORNING.

Figure 18:DAY 9-BLOCK C-AFTERNOON.

Figure 19:DAY 10-FACULTY OF NATURAL AND APPLIED SCIENCE-MORNING.
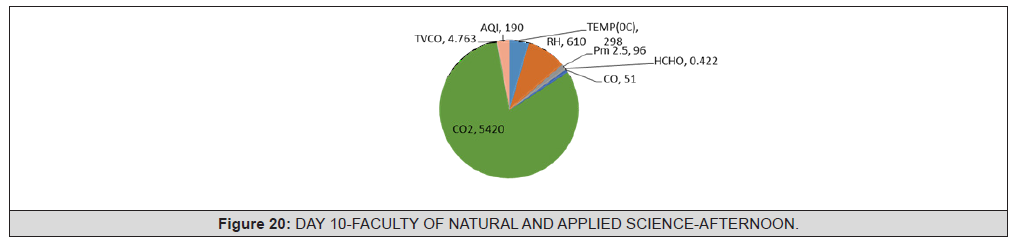
Figure 20:DAY 10-FACULTY OF NATURAL AND APPLIED SCIENCE-AFTERNOON.
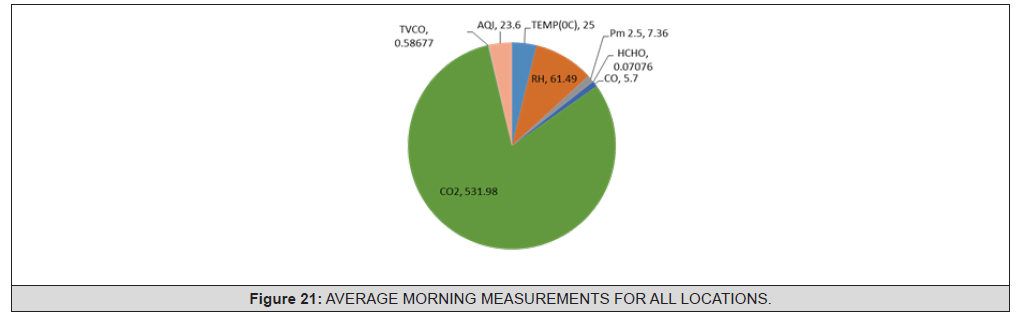
Figure 21:AVERAGE MORNING MEASUREMENTS FOR ALL LOCATIONS.
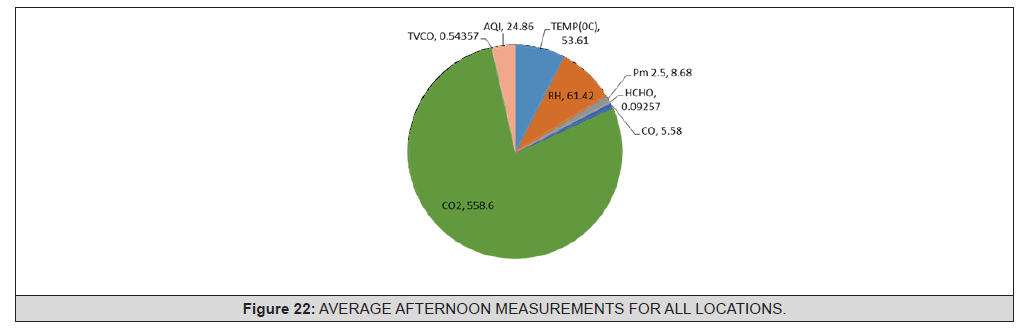
Figure 22:AVERAGE AFTERNOON MEASUREMENTS FOR ALL LOCATIONS.
Discussion of Findings
The study investigated various environmental parameters across different classroom locations, including morning temperature, Relative Humidity (RH), CO2 levels, CO levels, and Particulate Matter (PM) levels at Lead City University. Morning temperature exhibited significant variability across classroom locations, with the faculty of pharmacy experiencing the highest variance, suggesting extreme temperature fluctuations (25.7°C). Block C and Faculty of Natural and Applied Science had lower temperature variances (24.2°C), indicating more stable conditions. RH showed wide variations, with the Block C having the highest variance (64.4%), implying substantial humidity fluctuations. Faculty of Natural and Applied Science also exhibited high RH variances (64%), potentially impacting indoor air quality and comfort. Morning CO2 levels varied considerably, with University clinic and Block C pitch showing notably high variances (632.5%) and (600.7%) respectively, indicating potential pollution sources. Senate building and Law theatre had lower CO2 variances, suggesting better air quality management. Morning CO levels displayed a significant range, with the University clinic exhibiting remarkably high variance (8.2ppm), indicating substantial fluctuations in air pollution. Law theatre and faculty of pharmacy had relatively stable CO levels. Morning PM levels varied widely, with College of Medicine having an exceptionally high variance (16.2μg/m³), signifying severe particulate matter variability. In contrast, university clinic and university library maintained lower PM variances (6.2μg/m³), reflecting more consistent air quality.
Consequently, afternoon temperature variance was highest at Workshop, potentially affecting indoor comfort and energy consumption. Senate and Chapel exhibited lower temperature variances, providing more stable conditions.
Conclusion
The study revealed significant variations in environmental parameters across different classroom locations, highlighting the diverse conditions within the study area. These findings are consistent with the concept of microclimates influenced by local factors, including urbanization, geographical features, and climate patterns. Variability in these parameters can have implications for human health, indoor air quality, and energy consumption.
Recommendations
Based on the concluded findings, the following recommendations
could be made;
i. Urban Planning and Management: Urban areas should consider
the impact of urbanization and implement effective urban
planning and management strategies to mitigate temperature
and pollution fluctuations, especially in high-variance locations.
ii. Indoor Air Quality Management: Locations with high CO2 variance
should focus on improving indoor air quality through adequate
ventilation and pollution control measures. Healthcare
facilities, in particular, should prioritize indoor air quality to
ensure patient well-being.
iii. Traffic Management: Areas with high CO variance should explore
traffic management solutions to reduce air pollution
fluctuations, such as congestion and industrial emissions.
iv. Waste Management: Effective waste management and pollution
control measures are essential, as demonstrated by the
exceptionally high PM variance at the Dumpsite. Rigorous
waste management practices can help contain pollution.
v. Climate-Responsive Design: Locations with high temperature
and RH variances should consider climate-responsive building
design and energy-efficient solutions to enhance occupant
comfort and reduce energy consumption.
vi. Healthcare Facility Planning: Healthcare settings, where stable
environmental conditions are crucial, should prioritize RH
and CO2 control to maintain patient comfort and prevent mold
growth.
vii. Research and Monitoring: Continual research and monitoring
of environmental parameters are essential to assess long-term
trends, identify pollution sources, and implement effective
mitigation strategies.
Hence, these recommendations aim to address the observed environmental variations and enhance the quality of life, health, and sustainability within the study area.
Acknowledgments
None.
Conflicts of Interest
None.
References
- S C Barman, N Kumar, R Singh, G C Kisku, A H Khan, et al. (2010) Assessment of urban air pollution and its probable health impact. J Environ Biol 31: 913-920.
- Barman SC, Kumar N, Singh R (2010) Associations of cognitive function scores with carbon dioxide, ventilation, and volatile organic compound exposures in office workers: a controlled exposure study of Green and conventional office environments, Environmental Health Perspective 124(6): 805-812.
- Amegah AK, Agyei Mensah S (2017) Urban air pollution in Sub-Saharan Africa: Time for action. Environmental Pollution 220: 738-743.
- Abera A, Friberg J, Isaxon C, Jerrett M, Malmqvist E, et al. (2021) Air quality in Africa: Public health implications. Annu. Rev. Public Health 42(1): 193-210.
- M Kraus I, Juhásová Šenitková I (2017) OP Conf. Series: Materials Science and Engineering 245: 042072.
- DA Krawczyk, B Wadolowska (2018) Energy Procedia 147: 96-103.
- I Juhásová Šenitková, M Kraus (2018) SGEM 18 (6.3): 597-603.
- DL Johnson, RA Lynch, EL Floyd, J Wang, JN Bartels, et al. (2018) Building and Environment 136: 185-197.
- R Kosonen, F Tan (2004) Energy and Buildings 36 (10): 981-986.
- P Wargocki (1999) Indoor Air 9 (3): 165-179.
- Annesi Maesano I, Baiz N, Banerjee S, Rudnai P, Rive S, et al. (2013) Indoor Air Quality and Sources in Schools and Related Health Effects, Journal of Toxicology and Environmental Health, Part B (16)8: 491-550.
- Bakó Biró Z, Clements Croome DJ, Kochhar N, Awbi HB, Williams MJ, et al. (2012) Ventilation rates in schools and pupils’ performance. Building and Environment 48: 215-223.
- E Finell, A Tolvanen, U Haverinen Shaughnessy, S Laaksonen, S Karvonen, et al. (2018) Science of The Total Environment 624: 1504-1512.
- Hoskins JA, (2003) Health effects due to indoor air pollution, Indoor and Built Environment 12(6): 427-433.
- (2021) World Health Organization (WHO). Guidelines for outdoor Air Quality: Dampness and Mould.




 We use cookies to ensure you get the best experience on our website.