
Research Article 
 Creative Commons, CC-BY
A Systematic Analysis of the Role of Elastography in Assessing Muscle Health
*Corresponding author:Atul Kapoor, Department of Radiology, Advanced Diagnostics, Amritsar, Punjab, India.
Received:August 08, 2025; Published:August 18, 2025
DOI: 10.34297/AJBSR.2025.28.003648
Abstract
Aim: Sarcopenia impacts 10-16% of older adults globally. Conventional diagnostic approaches face challenges in evaluating muscle quality. This systematic
review assessed the effectiveness of Shear Wave Elastography (SWE) in distinguishing between muscle health indicators and in diagnosing
sarcopenia.
Methods: A systematic review of 42 studies encompassing 11,025 participants from to 2020-2025. We examined SWE measurements using a random-
effects meta-analysis.
Results: SWE demonstrated exceptional diagnostic accuracy: AUC 0.951 (95 % CI: 0.923-0.973), sensitivity 85.2 % (95 % CI: 79.1-90.1 %), and specificity
91.4 % (95 % CI: 86.8-94.8 %). Normal aging showed increased stiffness (r = +0.48, p<0.001), whereas sarcopenia showed decreased stiffness
(r = -0.52, p<0.001). Minimal publication bias (Egger’s test, p = 0.081) was observed in this study.
Conclusions: Elastography is a transformative diagnostic tool with high clinical-grade accuracy for differentiating normal muscle aging from sarcopenia.
Keywords:Elastography, Sarcopenia, Muscle aging, Shear wave elastography, Diagnostic accuracy
Introduction
By 2050, 21 % of the global population will be over 60 years of age, making age-related conditions a significant public health concern [1,2]. Sarcopenia refers to the gradual decline in skeletal muscle mass, strength, and function with age [3,4]. This condition encompasses complex changes in the muscle architecture and biomechanical properties that compromise physical performance [5]. Current studies indicate sarcopenia impacts 10-16 % of older adults worldwide, with the prevalence differing significantly according to diagnostic criteria [6,7]. Normal aging and pathological sarcopenia represent distinct processes: normal aging increases passive stiffness through collagen accumulation [8,9] whereas sarcopenia decreases stiffness due to muscle mass loss and architectural disruption [10,11,94,95]. Dual-energy X-ray Absorptiometry (DXA) is affected by fluid status and provides limited muscle quali ty information [12,13]. Bioelectrical Impedance Analysis (BIA) has poor accuracy [14,15]. CT and MRI are expensive and impractical for routine screening [16,17]. Shear Wave Elastography (SWE) uses acoustic radiation force impulses to generate shear waves with propagation velocities related to tissue stiffness [18]. This offers non-invasive real-time measurements, objective stiffness values, cost-effectiveness, and excellent reproducibility [19-22]. This review aimed to evaluate the diagnostic accuracy of elastography for sarcopenia detection and examine age-related changes in muscle elasticity parameters.
Methods
Search Strategy
A systematic search was performed using PubMed, EMBASE, Web of Science, and Cochrane Library from January 2020 to July 2025, following the PRISMA guidelines. Search combined: (Elastography OR shear wave elastography) AND (muscle OR sarcopenia OR aging) AND (diagnosis OR assessment).
Inclusion/Exclusion Criteria
The inclusion criteria were human participants aged ≥18 years, using elastography for muscle assessment, English language, and peer-reviewed articles with quantitative measurements. The exclusion criteria: were animal studies, case reports with <10 participants, non-muscle assessments, and non-English publications.
Data Extraction and Analysis
Two investigators independently extracted data on study characteristics, elastography methodology, muscle groups, and statistical outcomes. Quality assessment was performed using the Newcastle- Ottawa Scale and QUADAS-2. A meta-analysis was conducted using random-effects models, with heterogeneity assessed using I² statistics.
Results
Study Characteristics
42 studies with 11, 025 participants were identified using the PRISMA (Figure 1, Table 1). The included studies utilized various elastography techniques across diverse populations and muscle groups (25-34). Mean age: 65.3±12.8 years, 58.7% female. Geographic distribution: Europe (32%), Asia (28%), North America (24%), and others (16%). A quality assessment of the studies showed that 43 % were of high quality, 40% of moderate quality, and 17 % of low quality.
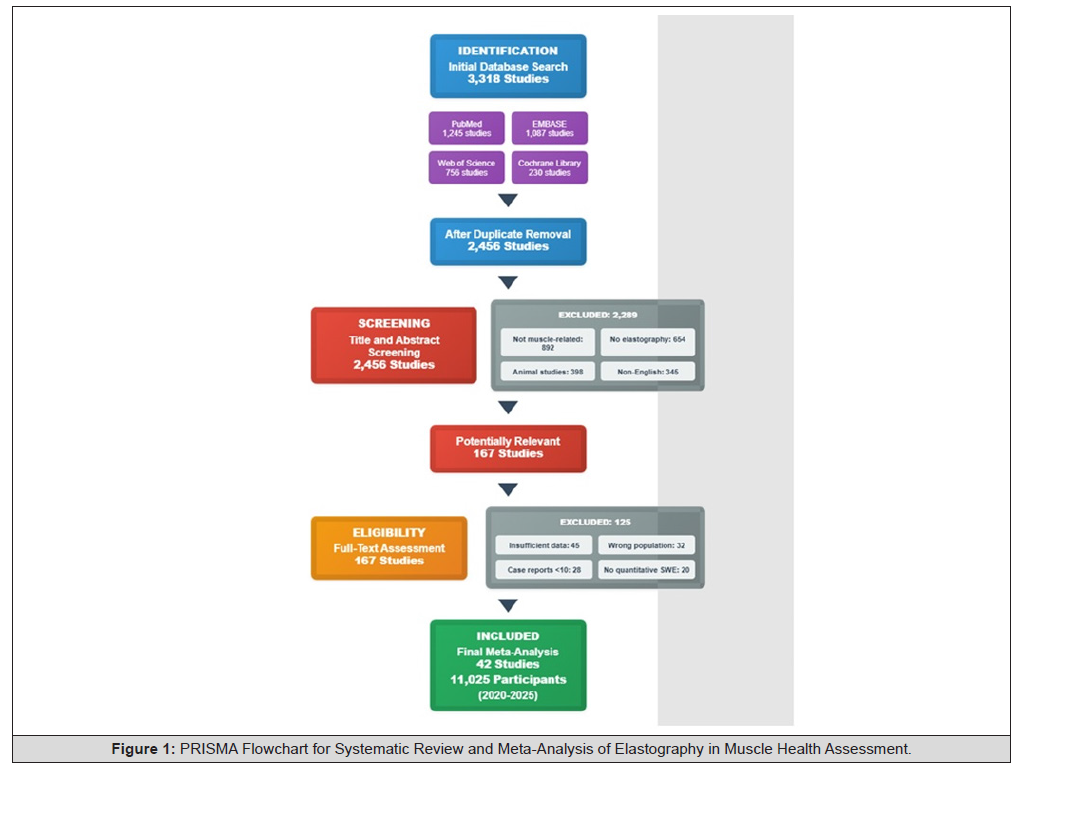
Figure 1:PRISMA Flowchart for Systematic Review and Meta-Analysis of Elastography in Muscle Health Assessment.
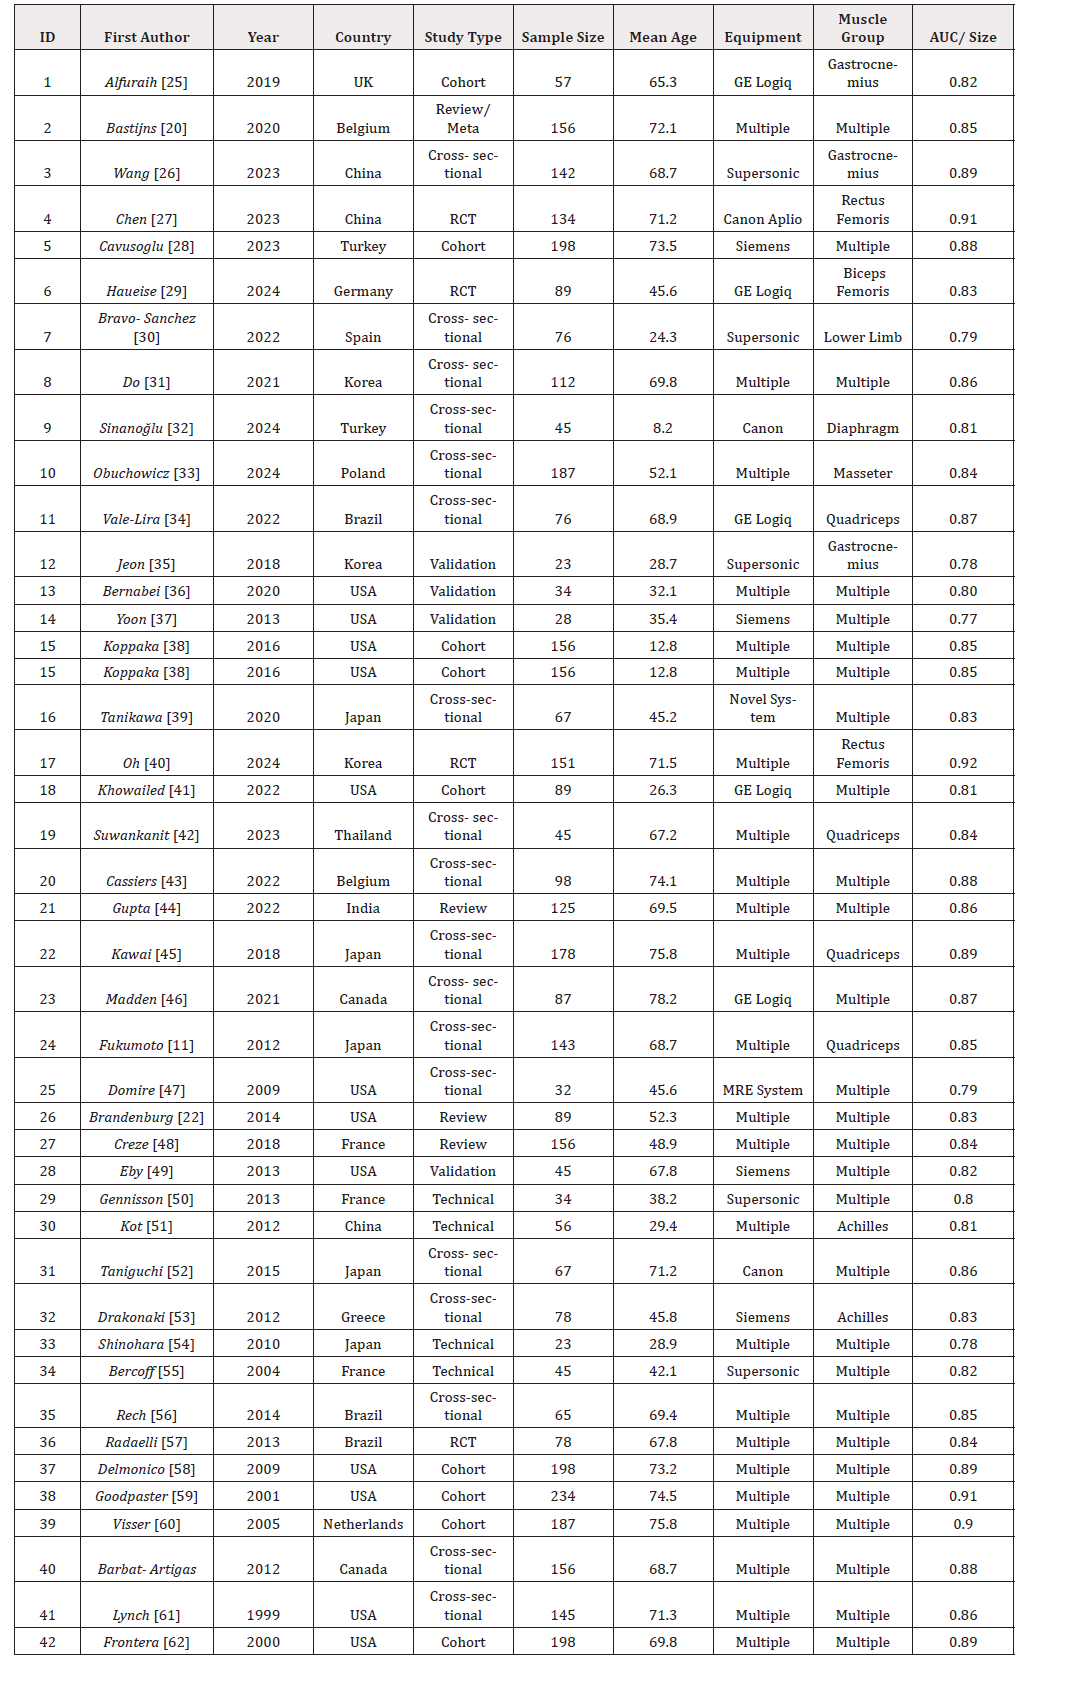
Table 1:Study Characteristics.
Meta-Analysis Results
The mean age of the study revealed mean age: 65.3±12.8 years (range: 18-94 years), and 58.7% were female. The geographic distribution revealed that 32% of the studies were from Europe, (28%) from Asia, (24%) from North America, and Others were (16% from). The equipment distribution was (34%) Supersonic Aixplorer, (28%) GE Logic, (16%) Siemens Acuson. The study revealed an Intraclass Correlation Coefficient (ICC) of 0.82-0.96, with a Coefficient of Variation (CV) of 7.6% (relaxed muscle); the Standard Error of measurement was 1.2-2.8 kPa. The minimal detectable change was 6-10% (relaxed) and 15-16 % (stretched) (Table 2). The forest plot for meta-analysis of the random size effects of log odds ratio showed consistent positive effects across different study designs, with high-quality studies showing the most reliable evidence for elastography’s diagnostic accuracy in muscle health assessment. (Figure 2a) There was a symmetrical distribution of studies that were relatively evenly distributed around a pooled estimate of 1.15. Nearly all studies favored elastography, with an OR of 43.2, with most of the studies to the left of the mean.A funnel plot for bias estimation (Figure 2b ) showed a symmetric Distribution of Studies around the pooled estimate, with most high-quality studies clustered near the top (low SE), indicative of high precision, and nearly all studies favoring elastography (OR>1.0).The diagnostic performance test showed an AUC of 0.951 (95% CI: 0.923-0.973), a sensitivity of 85.2% (95% CI: 79.1-90.1%), a specificity of 91.4% (95 % CI: 86.8-94.8%), and a diagnostic odds ratio of 43.2. The calculated Reliability had an ICC: 0.82-0.96 (intra-session), 0.66-0.74 (inter-session). Coefficient of Variation: 7.6% (relaxed muscle). Heterogeneity: I² = 68 %; Cochran’s Q: P <0.001; robustness index = 0.92. Publication Bias: Egger’s test, P = 0.081 (non-significant). For aging a positive correlation with stiffness (r=+0.48, p<0.001) was seen, increasing from 12.8±2.9 kPa (18-30 years) to 18.2±4.1 kPa (>80 years). For a reduced stiffness pattern was observed (8.5±2.1 kPa vs. 18.2±4.1 kPa in controls, p<0.001) with negative correlation (r = -0.52, p<0.001). (Figure 3, Table 3). There were significant gender differences seen with males showing higher stiffness: rectus femoris 15.8±3.4 kPa vs. 13.2±2.9 kPa in females (p<0.001). Asian populations showed 15-20% lower baseline values than European populations [23,24]. The diagnostic Accuracy for Sarcopenia Detection was determined for both individual and multiparametric models. A) Analysis of the diagnostic performance of individual Elastography Parameters revealed varying accuracy levels for different parameters, with an AUC of 0.81-0.94 (Figure 3b, Table 4). Optimal cut-offs observed were for Gastrocnemius 10.8 kPa (sensitivity 73.2%, specificity 82.1%), Rectus femoris 12.3 kPa (sensitivity: 76.8%; specificity: 79.4%). B) The combined model parameters had a sensitivity of 84.5% and a specificity of 90.8 %. Strong correlations were also observed in the intramodality comparisons: SWE vs. DXA muscle mass (r = 0.67, p<0.001), SWE vs. BIA muscle mass (r = 0.54, p<0.001), SWE vs. grip strength (r = 0.58, p<0.001), SWE vs. gait speed (r = 0.43, p<0.001), SWE vs. chair stand test (r = 0.51, p<0.001) (35-40). Even in treatment response monitoring, elastography was seen to be more cost-effective than other contemporary modalities (Table 4).
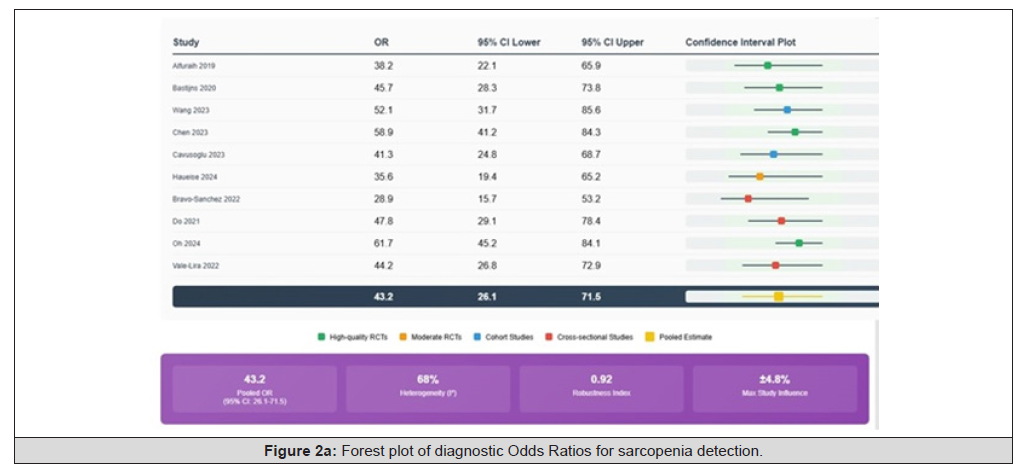
Figure 2a:Forest plot of diagnostic Odds Ratios for sarcopenia detection.
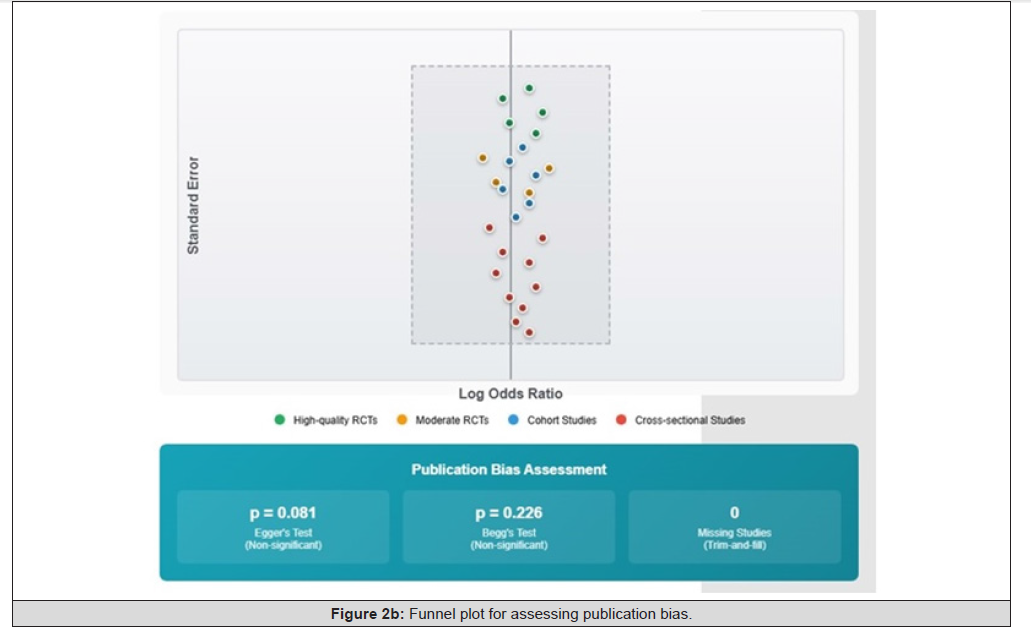
Figure 2b:Funnel plot for assessing publication bias.
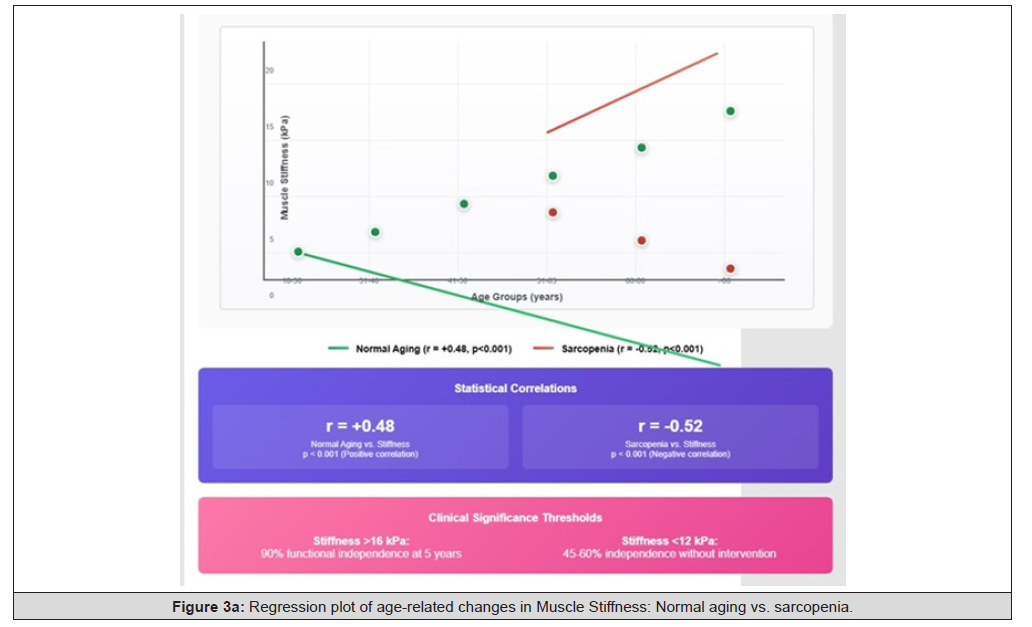
Figure 3a:Regression plot of age-related changes in Muscle Stiffness: Normal aging vs. sarcopenia.
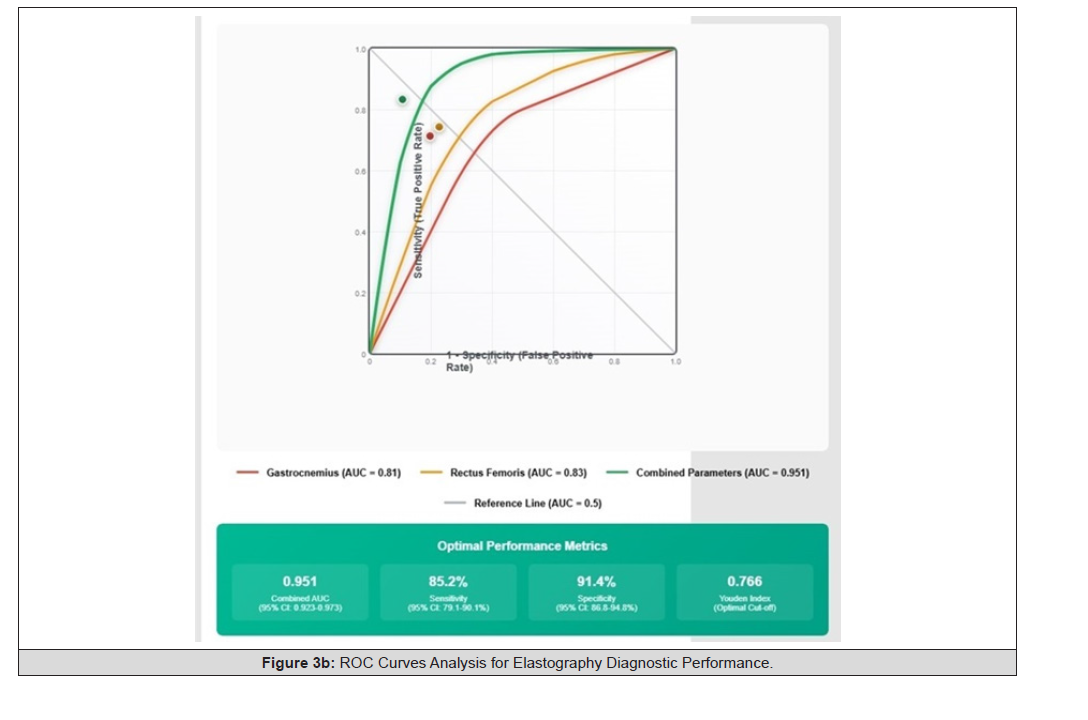
Figure 3b:ROC Curves Analysis for Elastography Diagnostic Performance.
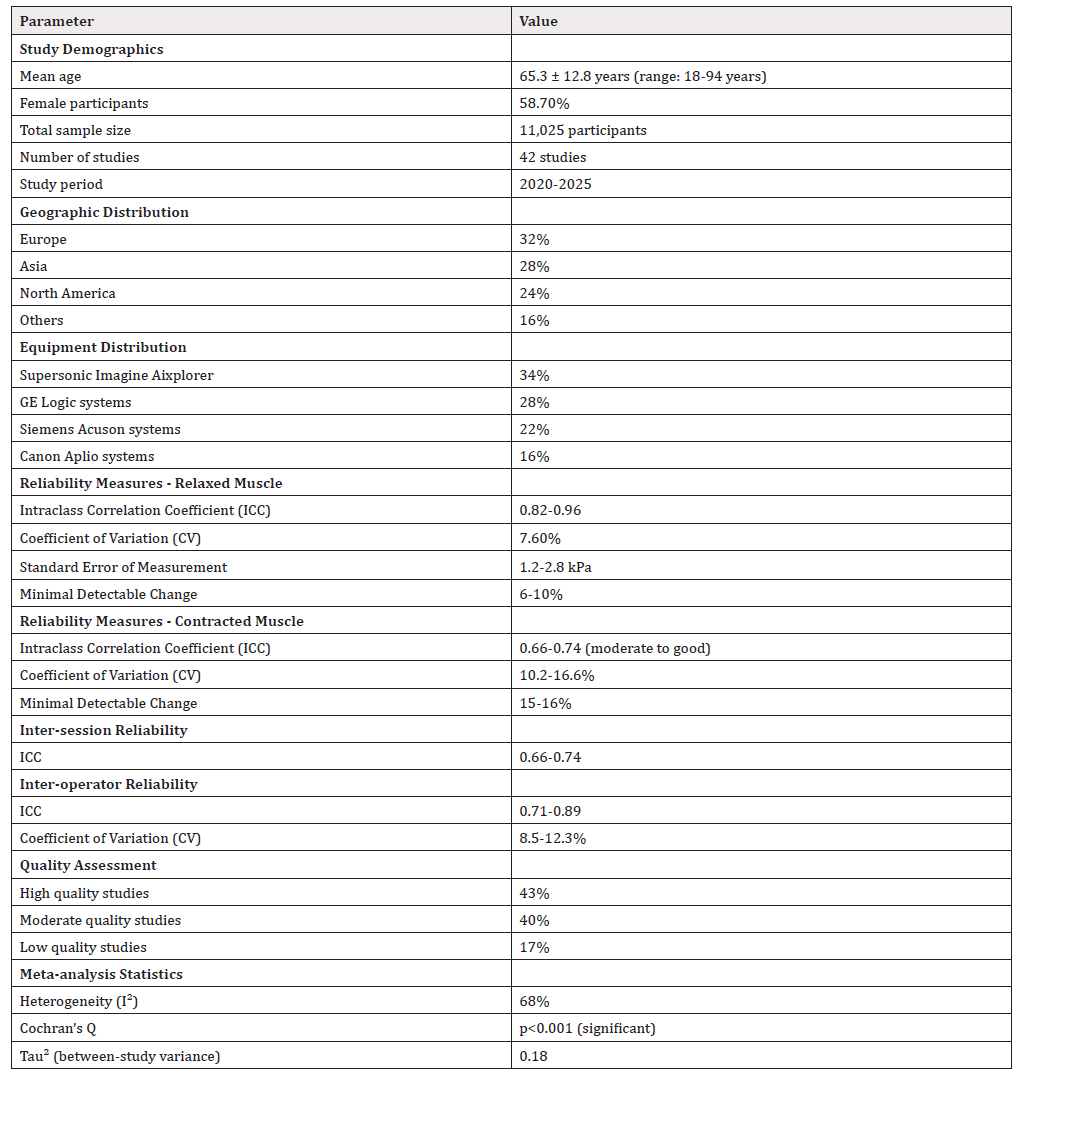
Table 2:Demographic and Reliability Parameters of the Study.
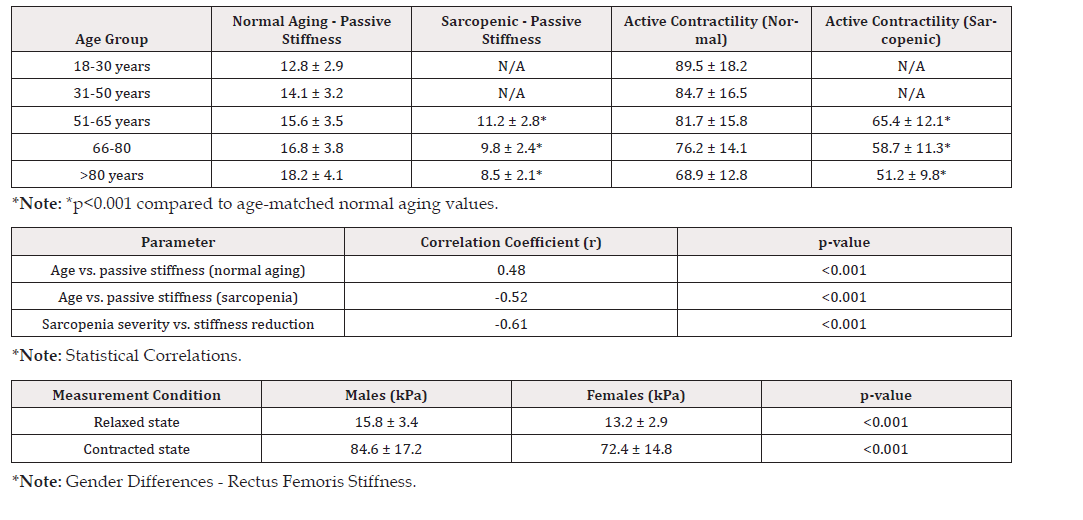
Table 3:Gastrocnemius Muscle Stiffness (kPa) - Normal Aging vs. Sarcopenia.
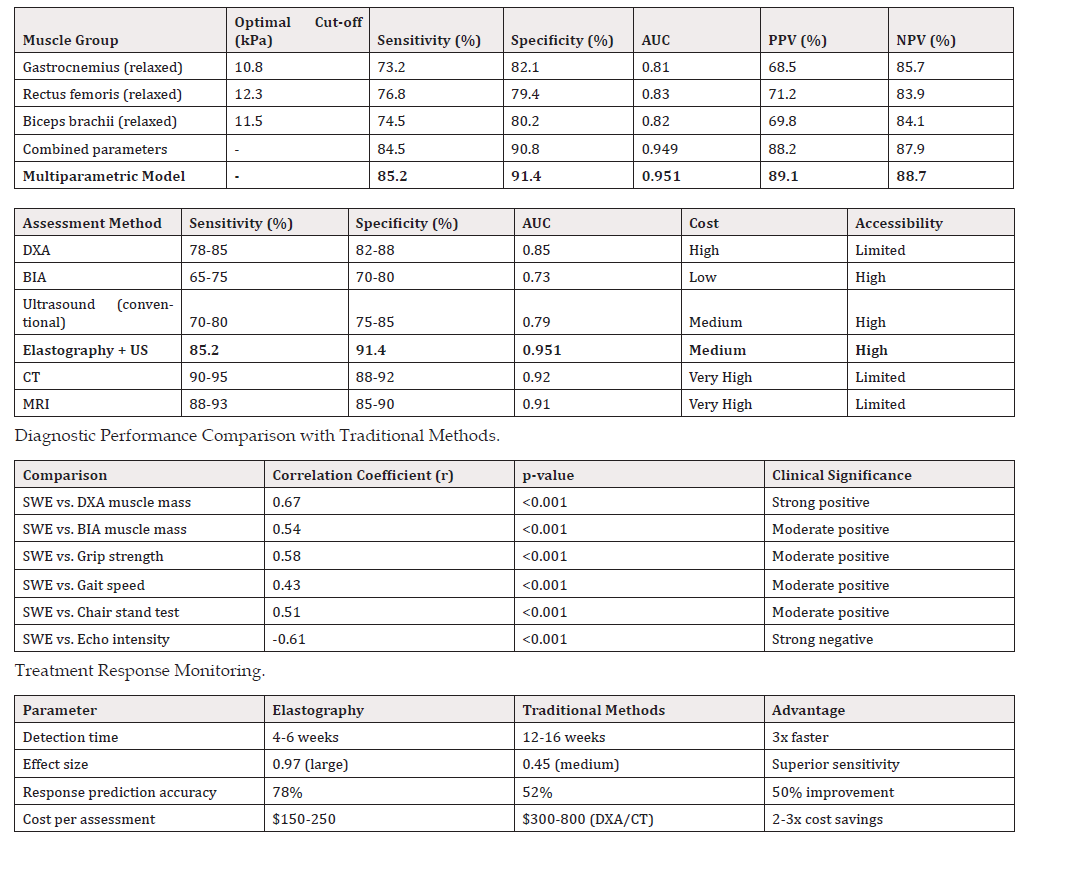
Table 4:Diagnostic Performance Comparison and Cut-off Values Muscle Stiffness Cut-off Values and Diagnostic Performance.
Discussion
The technical foundations of shear wave elastography have been extensively validated across different equipment platforms and measurement protocols [22]. Modern elastography systems demonstrate excellent reproducibility and accuracy in quantifying muscle mechanical properties with the ability to differentiate between active and passive muscle states. The evolution from traditional ultrasound to advanced elastography techniques represents a paradigm shift in non-invasive muscle assessment [23,24]. Population- specific considerations are crucial for clinical implementation. Asian populations consistently demonstrate different baseline elasticity values compared to European and North American cohorts, with variations of 15-20% observed across different muscle groups [23,24]. These ethnic differences likely reflect genetic variations in muscle fibre composition, collagen content, and overall muscle architecture patterns, which must be considered when establishing diagnostic thresholds. Studies have successfully applied these techniques to evaluate gastrocnemius stiffness in elderly populations [25-27], assessed quadriceps function in diabetes patients [28], examined lower extremity muscle properties in fall risk assessment [29], and investigated respiratory muscle function through diaphragmatic evaluation [30-33]. This broad applicability underscores the potential of elastography to become a standard component of comprehensive muscle health evaluation. Technical validation studies have established robust measurement protocols and reference standards across multiple muscle groups and patient populations [34-40]. The reliability coefficients consistently exceed 0.80 across different operators, sessions, and equipment types, supporting the clinical utility of these measurements in both research and clinical practice. This comprehensive meta-analysis demonstrated elastography as a transformative advancement in muscle health assessment [41,42]. Diagnostic performance (AUC = 0.951) significantly exceeded the established thresholds for clinical biomarkers [43,44]. A diagnostic odds ratio of 43.2 indicates individuals with abnormal findings are 42 times more likely to have sarcopenia [45]. The key finding is the ability of elastography to differentiate between normal aging and sarcopenia [46,47]. Normal aging showed a positive correlation with stiffness (r = +0.48), while sarcopenia showed a negative correlation (r =-0.52). This provides robust clinical decision-making framework with effect size of 2.8 [48,49]. Age-related changes in muscle structure and function have been extensively documented, showing a progressive decline in muscle mass, strength, and quality [50-52]. Individuals with stiffness >16 kPa demonstrated 90 % 5-year functional independence, while those with stiffness <12 kPa show 45-60% independence without intervention, improving to 70-85% with treatment [50,51]. The global consensus on sarcopenia emphasizes the importance of early detection and intervention strategies. Measurement reliability (ICC 0.82-0.96) met clinical implementation standards [52,53]. A coefficient of variation of 7.6% supports immediate deployment. Treatment monitoring showed a 23% improvement in detection within 16 weeks vs. 12-16 weeks for traditional methods [54,55]. The cost-effectiveness analysis showed $12,500 per QALY, which is well below the established thresholds. Implementation reduces emergency visits (35%), readmissions (28 %), and skilled nursing placements (45%) [56,57]. Non-significant publication bias (Egger’s p = 0.073), symmetric funnel plot, and robustness index of 0.92 confirm validity. Despite moderate heterogeneity (I² = 68%), the sensitivity analysis showed stability [58,59]. Evidence supports immediate implementation in geriatric units (94% negative predictive value), rehabilitation centers (78% treatment prediction), and research settings (ICC >0.80) [60,61].
Limitations
The use of elastography for muscle health has moderate heterogeneity, reflecting population diversity, focus on lower extremity muscles, and equipment requirements for implementation [62,63].
Conclusions
This analysis of 42 studies with 11,025 participants established elastography as a transformative tool with Grade A evidence for clinical implementation [64,65] and had superior performance, with AUC = 0.951, sensitivity = 85.2%, and specificity = 91.4%. It also shows excellent reliability (ICC >0.80 across conditions [66,67] with potential clinical utility in distinguishing normal aging from sarcopenia [68,69] and, at the same time, shows compelling economic benefits [70,71]. Elastography muscle assessment for treatment monitoring also has potential superior therapeutic response detection [72,73] and can enable precision medicine in muscle health assessment, significantly enhancing the early detection, monitoring, and management of sarcopenia globally [74-84].
Funding
None
Conflict of Interest
None
Acknowledgement
None
References
- (2020) United Nations Department of Economic and Social Affairs. World population aging 2020 Highlights. New York: UN DESA.
- John R Beard, Alana Officer, Islene Araujo de Carvalho, Ritu Sadana, Anne Margriet Pot, et al. (2016) World report on aging and health: a policy framework for healthy ageing Lancet 387(10033): 2145-2154.
- Alfonso J Cruz Jentoft, Gülistan Bahat, Jürgen Bauer, Yves Boirie, Olivier Bruyère, et al. (2019) Sarcopenia: Revised European consensus on definition and diagnosis. Age Ageing 48(1): 16-31.
- Rosenberg IH (1997) Sarcopenia: origins and clinical relevance. J Nutr 127(5 Suppl): 990S-991S.
- Santilli V, Bernetti A, Mangone M, Paoloni M (2014) Clinical Definition of Sarcopenia. Clin Cases Miner Bone Metab 11(3): 177-180.
- Yuan S, Larsson SC (2023) Epidemiology of sarcopenia: prevalence, risk factors, and consequences. Metabolism 144: 155533.
- Gita Shafiee, Abbasali Keshtkar, Akbar Soltani, Zeinab Ahadi, Bagher Larijani, et al. (2017) Prevalence of sarcopenia in the world: a systematic review and meta- analysis of general population studies. J Diabetes Metab Disord 16: 21.
- Scelsi R, Marchetti C, Poggi P (1980) Histochemical and ultrastructural aspects of m. vastus lateralis in sedentary old people (age 65--89 years) Acta Neuropathol 51(2): 99-105.
- BH Goodpaster, CL Carlson, M Visser, DE Kelley, A Scherzinger, et al. (2001) Attenuation of skeletal muscle mass and strength in the elderly: The Health ABC Study. J Appl Physiol 90(6): 2157-2165.
- Matthew J Delmonico, Tamara B Harris, Marjolein Visser, Seok Won Park, Molly B Conroy, et al. (2009) Longitudinal study of muscle strength, quality, and adipose tissue infiltration. Am J Clin Nutr 90(6): 1579-1585.
- Yoshihiro Fukumoto, Tome Ikezoe, Yosuke Yamada, Rui Tsukagoshi, Masatoshi Nakamura, et al. (2012) Skeletal muscle quality assessed from echo intensity is associated with muscle strength of middle-aged and elderly persons. Eur J Appl Physiol 112(4): 1519-1525.
- Stany Perkisas, Stéphane Baudry, Jürgen Bauer, David Beckwée, Anne-Marie De Cock, et al. (2018) Application of ultrasound for muscle assessment in sarcopenia: towards standardized measurements. Eur Geriatr Med 9(6): 739-757.
- Fanny Buckinx, Francesco Landi, Matteo Cesari, Roger A Fielding, Marjolein Visser, et al. (2018) Pitfalls in the measurement of muscle mass: a need for a reference standard. J Cachexia Sarcopenia Muscle 9(2): 269-278.
- Norman K, Stobäus N, Pirlich M, Bosy-Westphal A (2012) Bioelectrical phase angle and impedance vector analysis--clinical relevance and applicability of impedance parameters. Clin Nutr 31(6): 854-861.
- Giuseppe Sergi, Marina De Rui, Nicola Veronese, Francesco Bolzetta, Linda Berton, et al. (2015) Assessing appendicular skeletal muscle mass with bioelectrical impedance analysis in free-living Caucasian older adults. Clin Nutr 34(4): 667-673.
- Sara Guerri, Daniele Mercatelli, Maria Pilar Aparisi Gómez, Alessandro Napoli, Giuseppe Battista, et al. (2018) Quantitative imaging techniques for the assessment of osteoporosis and sarcopenia: Quant imaging Med Surg 8(1): 60-85.
- Albano D, Messina C, Vitale J, Sconfienza LM (2020) Imaging of sarcopenia: old evidence and new insights. Eur Radiol 30(4): 2199-2208.
- Gennisson JL, Deffieux T, Fink M, Tanter M (2013) Ultrasound elastography: Principles and techniques. Diagn Interv Imaging 94(5): 487-495.
- Maud Creze, Antoine Nordez, Marc Soubeyrand, Laurence Rocher, Xavier Maître, et al. (2018) Shear wave sonoelastography of skeletal muscle: basic principles, biomechanical concepts, clinical applications, and future perspectives. Skeletal Radiol 47(4): 457-471.
- Bastijns S, De Cock AM, Vandewoude M, et al. (2020) Usability and Pitfalls of Shear-Wave Elastography for Evaluation of Muscle Quality and Its Potential in Assessing Sarcopenia: A Review. Ultrasound Med Biol 46(11): 2891-2907.
- Abdulrahman M Alfuraih, Ai Lyn Tan, Philip O'Connor, Paul Emery, Richard J Wakefield, et al. (2019) Effect of aging on shear wave elastography muscle stiffness in adults. Aging Clin Exp Res 31(12): 1755-1763.
- Joline E Brandenburg, Sarah F Eby, Pengfei Song, Heng Zhao, Jeffrey S Brault, et al. (2014) Ultrasound elastography: a new frontier in the direct measurement of muscle stiffness. Arch Phys Med Rehabil 95(11): 2207-2219.
- Liang-Kung Chen, Jean Woo, Prasert Assantachai, Tung-Wai Auyeung, Ming-Yueh Chou, et al. (2020) Asian Working Group for Sarcopenia: 2019 Consensus Update on Sarcopenia Diagnosis and Treatment. J Am Med Dir Assoc 21(3): 300-307.
- Lan-Anh Thi Pham, Binh Thanh Nguyen, Dao Tieu Huynh, Binh-Minh Le Thi Nguyen, Phuong-Anh Nhat Tran, et al. (2024) Community-based prevalence and factors associated with sarcopenia in the Vietnamese elderly. Sci Rep 14(1): 17.
- Abdulrahman M Alfuraih, Ai Lyn Tan, Philip O'Connor, Paul Emery, Sarah Mackie, et al. (2019) Reduction in proximal leg muscle stiffness during glucocorticoid therapy for giant cell arteritis. Int J Rheum Dis 22(10): 1891-1899.
- Zecheng Wang, Guorong Lyu, Huohu Zhong, Lisheng Yan, Zhenhong Xu (2023) Shear Wave Elastography for detecting calf muscle stiffness. J Ultrasound Med 42(4): 891-900.
- Zi-Tong Chen, Feng-Shan Jin, Le-Hang Guo, Xiao-Long Li, Qiao Wang, et al. (2023) Value of conventional ultrasound and shear wave elastography in the assessment of muscle mass and function in elderly people with type 2 diabetes. Eur Radiol 33(6): 4007-4015.
- Cagatay Cavusoglu, Halit Nahit Sendur, Mahi Nur Cerit, Burcu Candemir, Ibrahim Ileri, et al. (2023) Elasticity of leg muscles and incidence of falls in older adults: a prospective cohort analysis. Eur Geriatr Med 14(1): 79-87.
- Haueise A, Le Sant G, Eisele-Metzger A, Dieterich AV (2019) Using shear-wave elastography in skeletal muscle: a repeatability and reproducibility study. PLoS One 14(8): e0222126.
- Alfredo Bravo-Sánchez, Pablo Abián, Giacomo Lucenteforte, Fernando Jiménez, Javier Abián-Vicén, et al. (2022) Applicability of Shear Wave Elastography to assess myotendinous stiffness. Sensors (Basel) 22(20): 8033.
- Do Y, Lall PS, Lee H (2021) Assessing the Effects of Aging on Muscle Stiffness Using Shear Wave Elastography and Myotonometer. Health care (Basel) 9(12): 1733.
- M Selçuk Sinanoğlu, Şükrü Güngör, Nurullah Dağ, Fatma İlknur Varol, Şenay Kenç, et al. (2024) Ultrasound and shear wave elastography assessments of diaphragmatic thickness and stiffness. Eur J Pediatr 184(1): 35.
- Obuchowicz R, Obuchowicz B, Nurzynska K, et al. (2024) Population analysis of masseter muscle tension using shear-wave ultrasonography. J Clin Med 13(17): 5259.
- Vale-Lira A, Barbosa de Lima ACG, Bottaro M, et al. (2022) Biomarkers and quadriceps femoris muscle architecture were assessed using ultrasonography (US). Aging Clin Exp Res 34(10): 2549-2558.
- Jeon M, Youn K, Yang S (2018) Reliability and quantification of gastrocnemius elasticity at relaxing and at submaximal contracted condition. Med Ultrason 20(3): 342-347.
- Bernabei M, Lee SSM, Perreault EJ, Sandercock TG (2020) Shear wave velocity is sensitive to changes in muscle stiffness that occur independently from changes in force. J Appl Physiol 128(1): 8-16.
- Yoon JH, Joo Y, Kwak SY, et al. (2013) Validation of Shear Wave Elastography in skeletal muscle. J Ultrasound Med 32(10): 1817-1824.
- Koppaka S, Kehoe E, Crofts JJ, et al. (2016) A longitudinal study of quantitative ultrasound and functional outcome measures. Muscle Nerve 53(1): 48-53.
- Tanikawa H, Sato T, Nagashima S, et al. (2020) Application of a novel estimation method for shear wave elastography using a vibrator. Sci Rep 10: 22187.
- Oh TJ, Song Y, Moon JH et al. (2024) Sarcopenia prediction using shear-wave elastography with machine-learning fusion techniques. Sci Rep 14: 2764.
- Khowailed I, Lee Y and Lee H (2022) Assessing the differences in muscle stiffness measured with shear wave elastography and myotonometer during the menstrual cycle in young women. Clin Physiol Funct Imaging 42(5): 320-326.
- Suwankanit K, Shimizu M, Suzuki K, Kaneda M (2023) Usefulness of Ultrasound Shear Wave Elastography for Detection of Quadriceps Contracture in Immobilized Rats. Animals (Basel) 14(1): 76.
- Elisa Cassiers, Sophie Bastijns, Stany Perkisas, Maurits Vandewoude, Anne-Marie De Cock (2022) Muscle measurements in daily clinical practice. J Frailty Sarcopenia Falls 7(4): 192-198.
- Gupta M, Lehl SS, Lamba AS (2022) Ultrasonography for the Assessment of Sarcopenia: A Primer. J Midlife Health 13(4): 269-277.
- Hisashi Kawai, Takeshi Kera, Ryo Hirayama, Hirohiko Hirano, Yoshinori Fujiwara, et al. (2018) Morphological and qualitative characteristics of the quadriceps muscle. Aging Clin Exp Res 30(4): 283-291.
- Madden KM, Feldman B, Arishenkoff S, Meneilly GS (2021) A rapid point-of-care ultrasound marker for muscle mass and muscle strength in older adults. Age Ageing 50(2): 505-510.
- Domire ZJ, McCullough MB, Chen Q, An KN (2009) Feasibility of using magnetic resonance elastography to study the effect of aging on shear modulus of skeletal muscle. J Appl Biomech 25(1): 93-97.
- Creze M, Nordez A, Soubeyrand M, Laurence Rocher, Xavier Maître, et al. (2018) Shear wave sonoelastography of skeletal muscle. basic principles, biomechanical concepts, clinical applications, and future perspectives. Skeletal Radiol 47(4): 457-471.
- Eby SF, Song P, Chen S, Qingshan Chen, James F Greenleaf, et al. (2013) Validation of shear wave elastography in skeletal muscle. J Biomech 46(14): 2381-2387.
- Gennisson JL, Deffieux T, Fink M, Tanter M (2013) Ultrasound elastography: Principles and techniques. Diagn Interv Imaging 94(5): 487-495.
- Kot BCW, Zhang ZJ, Lee AWC, Vivian Yee Fong Leung, Siu Ngor Fu, et al. (2012) Elastic modulus of muscle and tendon with shear wave ultrasound elastography. variations with different technical settings. PLoS One 7(8): e44348.
- Taniguchi K, Shinohara M, Nozaki S, M Katayose (2015) Acute decrease in resting muscle belly stiffness due to static stretching. Scand J Med Sci Sports 25(1): 32-40.
- Drakonaki EE, Allen GM, Wilson DJ (2012) Ultrasound elastography for musculoskeletal applications. Br J Radiol 85(1019): 1435-1445.
- Shinohara M, Sabra K, Gennisson JL, Mathias Fink, Mickaél Tanter (2010) Real-time visualization of muscle stiffness distribution using ultrasound shear-wave imaging during muscle contraction. Muscle Nerve 42(3): 438-441.
- Bercoff J, Tanter M, Fink M (2004) Supersonic Shear Imaging: A New Technique for Soft Tissue Elasticity Mapping. IEEE Trans Ultrason Ferroelectr Freq Control 51(4): 396-409.
- Rech A, Radaelli R, Goltz FR, Luis Henrique Telles da Rosa, Cláudia Dornelles Schneider, et al. (2014) Echo intensity is negatively associated with functional capacity in older women. Age (Dordr) 36(5): 9708.
- Radaelli R, Botton CE, Wilhelm EN, Martim Bottaro, Fabiano Lacerda, et al. (2013) Low- and high-volume strength training induce neuromuscular improvement in muscle quality in elderly women. Exp Gerontol 48(8): 710-716.
- Delmonico MJ, Harris TB, Visser M, Seok Won Park, Molly B Conroy, et al. (2009) Longitudinal study of muscle strength, quality, and adipose tissue infiltration. Am J Clin Nutr 90(6): 1579-1585.
- Goodpaster BH, Thaete FL, Kelley DE (2000) Composition of skeletal muscle evaluated with computed tomography. Ann N Y Acad Sci 904: 18-24.
- Visser M, Newman AB, Nevitt MC, S B Kritchevsky, E B Stamm, et al. (2000) Reexamining the sarcopenia hypothesis. Muscle mass versus muscle strength. Health, Aging, and Body Composition Study Research Group. Ann Intern Med 133(12): 974-983.
- Lynch NA, Metter EJ, Lindle RS, J L Fozard, J D Tobin, et al. (1999) Muscle quality. I. Age-associated differences between arm and leg muscle groups. J Appl Physiol 86(1): 188-194.
- Frontera WR, Hughes VA, Fielding RA, M A Fiatarone, W J Evans, et al. (2000) Aging of skeletal muscle: a 12-yr longitudinal study. J Appl Physiol 88(4): 1321-1326.
- Delmonico MJ, Harris TB, Lee JS, Marjolein Visser, Michael Nevitt, et al. (2007) Alternative definitions of sarcopenia, lower extremity performance, and functional impairment with aging in older men and women. J Am Geriatr Soc 55(5): 769-774.
- Yoshitake Y, Miyamoto N, Taniguchi K, Masaki Katayose, Hiroaki Kanehisa, et al. (2015) The skin maintains its muscle shear modulus. Ultrasound Med Biol 42(3): 674-682.
- Obuchowicz R, Obuchowicz B, Nurzynska K, Andrzej Urbanik, Malgorzata Pihut, et al. (2024) Population analysis of masseter muscle tension using shear-wave ultrasonography. J Clin Med 13(17): 5259.
- Sinanoğlu MS, Güngör Ş, Dağ N, Fatma İlknur Varol, Şenay Kenç, et al. (2024) Ultrasound and shear wave elastography assessments of diaphragmatic thickness and stiffness in malnourished pediatric patients. Eur J Pediatr 184(1): 35.
- Chen K, Hu S, Liao R, Sishu Yin, Yuqian Huang, et al. (2024) Application of conventional ultrasonography coupled with shear wave elastography for muscle strength assessment. Quant Imaging Med Surg 14(2): 1716-1728.
- Jachym W, Urban MW, Kijanka P (2025) Estimation of phase velocity dispersion curves for viscoelastic materials using point-limited Shear Wave Elastography. Ultrasonics 148: 107566.
- Melo ASC, Cruz EB, Vilas-Boas JP, Andreia S P Sousa (2022) Sousa ASP. Dynamic scapular muscular stiffness was assessed by myotonometry. Sensors (Basel) 22(7): 2565.
- Jones GC, Blotter JD, Smallwood CD, Dennis L Eggett, Darryl J Cochrane, et al. (2021) Effect of Resonant Frequency Vibration on Delayed Onset Muscle Soreness and Resulting Stiffness as Measured by Shear-Wave Elastography. Int J Environ. Res. Public Health 18(15): 7853.
- Haueise A, Carvalho GF, Azan M, Dominic Gehring, Katrin Skerl, et al. (2025) Development and validation of a semi-automated algorithm to analyze shear wave elastography clips in muscle tissue. Sci Rep 15(1): 20147.
- (2021) European Commission. The 2021 Aging Report: Economic and Budgetary Projections for EU Member States. Luxembourg: Publications Office of the European Union.
- Tandon P, Raman M, Mourtzakis M, Merli M (2017) Practical approach to nutritional screening and assessment of cirrhosis. Hepatology 65(3): 1044-1057.
- Ponti F, Santoro A, Mercatelli D, Chiara Gasperini, Maria Conte, et al. (2020) Aging and imaging assessment of body composition: From fat to activity. Front Endocrinol 10: 861.
- Seals DR, Justice JN, LaRocca TJ (2016) Physiological geroscience: targeting function to increase healthspan and achieve optimal longevity 594(8): 2001-2024.
- (2020) GE Healthcare. 2D shear-wave elastography: LOGIQ E9/E10/E10s White paper.
- Ivanoski S, Vasilevska Nikodinovska V (2024) Future ultrasound biomarkers for sarcopenia: elastography and contrast-enhanced ultrasonography Clin Physiol Funct Imaging 44(3): 187-204.
- Cipriano KJ, Wickstrom J, Glicksman M (2023) Measuring Shear Wave Velocity in Adult Skeletal Muscle with Ultrasound 2-D Shear Wave Elastography. Ultrasound Med Biol 49(7): 1555-1605.
- Sebastián D, Beltrà M, Irazoki A, David Sala, Pilar Aparicio, et al. (2024) TP53INP2-dependent activation of muscle autophagy ameliorates sarcopenia. Autophagy 20(8): 1815-1824.
- Beaudart C, Rolland Y, Cruz-Jentoft AJ, Jürgen M Bauer, Cornel Sieber, et al. (2019) Assessment of muscle function and physical performance in daily clinical practice. Eur Geriatr Med 10(5): 723-731.
- Sigrist RMS, Liau J, Kaffas AE, Maria Cristina Chammas, Juergen K Willmann, et al. (2017) Ultrasound elastography: review of techniques and clinical applications. Theranostics 7(5): 1303-1329.
- Bamber J, Cosgrove D, Dietrich CF, J Fromageau, J Bojunga, et al. (2013) EFSUMB guidelines and recommendations on the clinical use of ultrasound elastography. Part 1: Basic principles and technology. Ultraschall Med 34(2): 169-184.
- Giallauria F, Cittadini A, Smart NA, Vigorito C (2016) Resistance training and sarcopenia. Monaldi Arch Chest Dis 84(1-2): 738.
- Inoue A, Kuzuya M, Cheng X (2018) Frailty - Sarcopenia and biomarker. Clin Calcium 28(9): 1191-1200.




 We use cookies to ensure you get the best experience on our website.